It’s natural to feel nervous when markets fall. News about inflation and rising interest rates may prompt you to make an emotional investment decision. But history tells us that markets trend upwards in the long run – and switching investment options at the wrong time can have a negative impact on your overall long-term investment return.
If you feel anxious when you see your balance drop and worry about your retirement savings, know that it’s a common reaction. And it’s natural to consider switching your super into a more defensive portfolio mix to avoid market turmoil. But doing so could mean locking in losses and missing out on the recovery which follows.
A year with a negative return can be stressful, although the general long-term trend is for markets to grow, not contract. The Australian share market has only recorded five negative years in the three decades since compulsory superannuation was introduced in 1992.
Here are three examples of market falls, and their following recoveries.
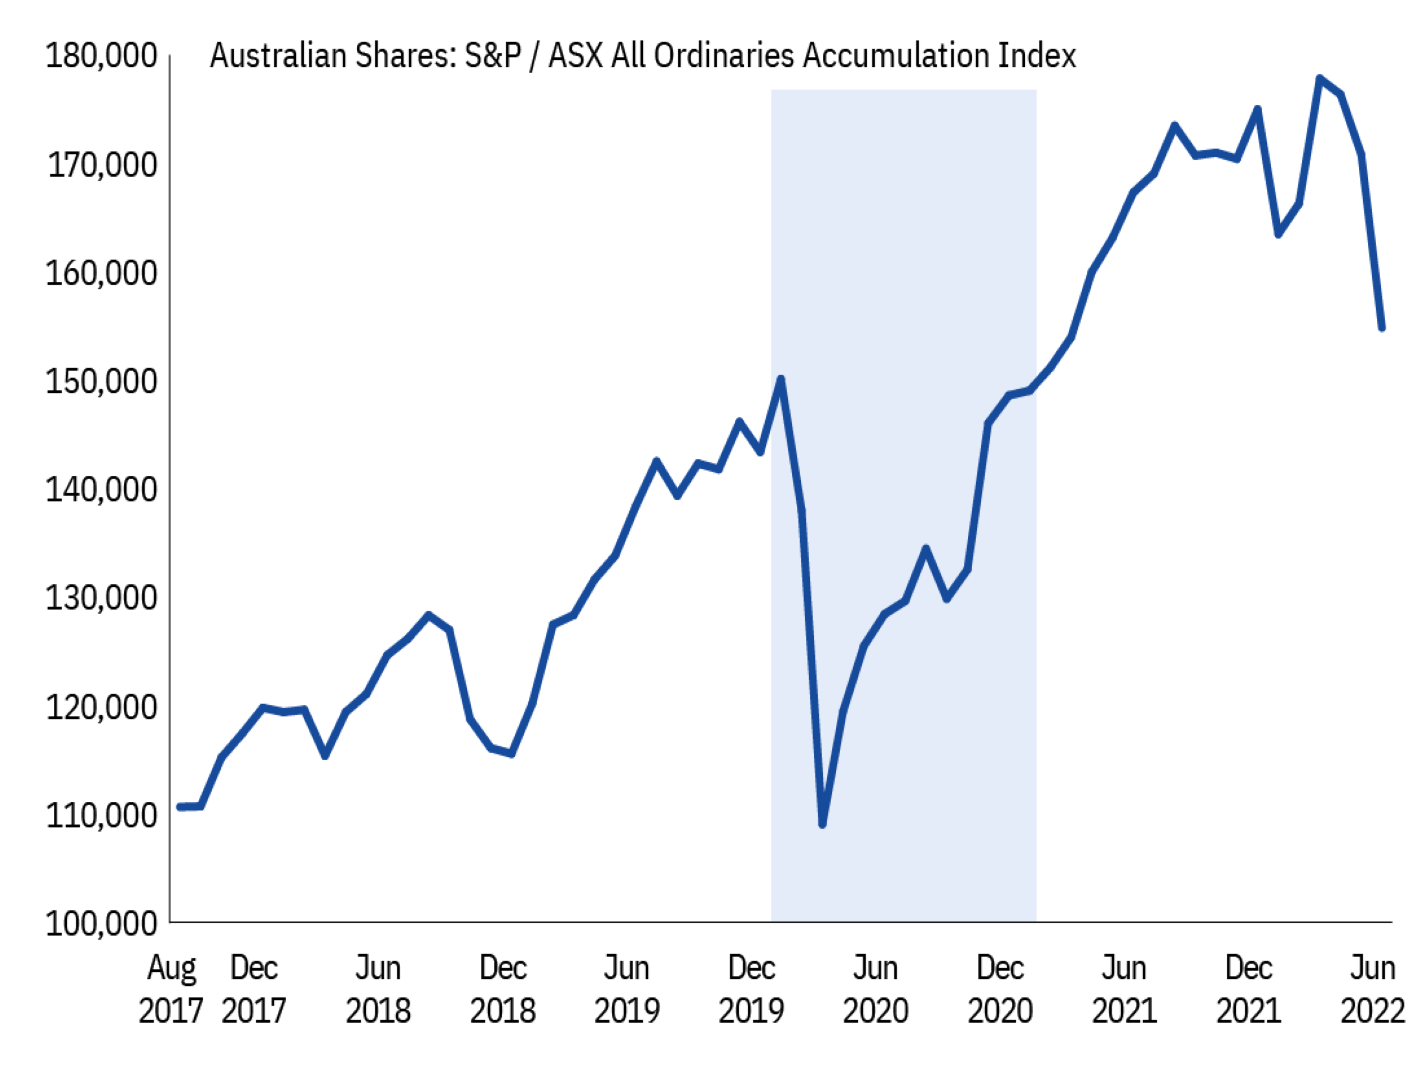
The COVID Crash 2020
Why did this happen?
In March 2020, the world started to realise how serious the rapid spread of COVID-19 really was. Governments enforced lockdowns, air travel was all but outlawed and investors desperately sold off their shares fearing these restrictions would hurt companies’ growth plans and profit margins.
What did it mean for investors at the time?
It all came to a head on 16 March 2020, when the ASX 200 recorded its worst day ever (down 9.7%) while in the US, the S&P500, Dow Jones Industrial Average and NASDAQ indices all lost 12% or more.
What was the best thing investors could do at the time?
Investors who switched to cash at the end of March, hoping to protect themselves, were 22% to 27% worse-off on average than those who held on through the drop. Share markets didn’t just recover – they grew to new highs. And people who stayed invested benefited from that growth.

Source: S&P Index Data Services. S&P/ASX All Ordinaries Accumulation Index. Date from 31 August 2017 to 30 June 2022.
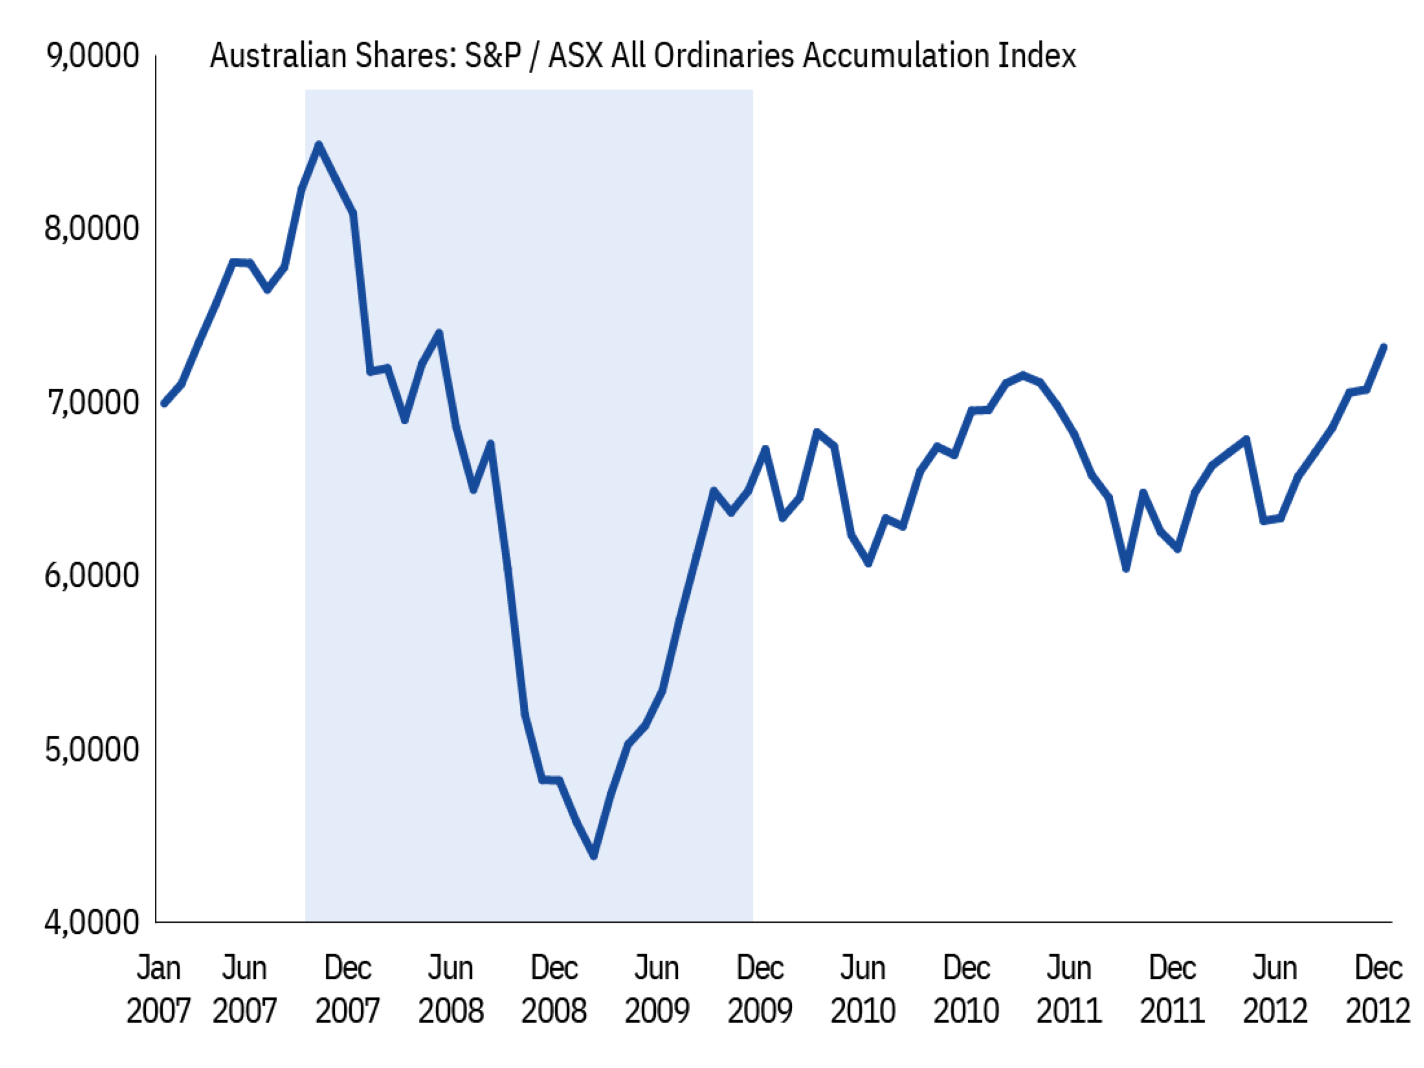
Global Financial Crisis 2007 – 2009
Why did this happen?
The mid 2000s was a prosperous period for developed countries and mortgage lending became a lucrative business for banks. With house prices rising and regulators unworried about the potential risks, banks in the US began lending increasingly large sums to borrowers. included lending to borrowers with a high risk of default. US banks packaged up and on-sold those risky loans to investors.
Then in 2007 interest rates rose and house prices fell. Homeowners found themselves unable to make the repayments on their mortgage and owed more than their homes were now worth. As people walked away from their obligations, banks quickly racked up massive losses. The investors who’d bought the risky loans also lost money. The interconnectedness of global finance meant banks around the world experienced significant losses with some collapsing.
The resulting fallout remains one of the worst economic downturns since the Great Depression of the 1930s.
What did it mean for investors at the time?
The Australian share market fell 54% – a painful, drawn-out decline over 16 months from November 2007 to March 2009. But by 2013, US markets had returned to their pre-crisis highs. Australia took a little longer to regain its losses, finally breaking back above its pre-crisis levels in 2019. This may be because Australian companies pay a greater share of their earnings as dividends to investors compared with US companies.
What was the best thing investors could do at the time?
Staying invested during the Global Financial Crisis proved the best strategy, despite testing investor nerves. Yet anyone who switched their investments to cash locked in those original losses and missed out on the multi-year gains that followed.

Source: S&P Index Data Services. S&P/ASX All Ordinaries Accumulation Index. Date from 31 January 2007 to 31 December 2012.
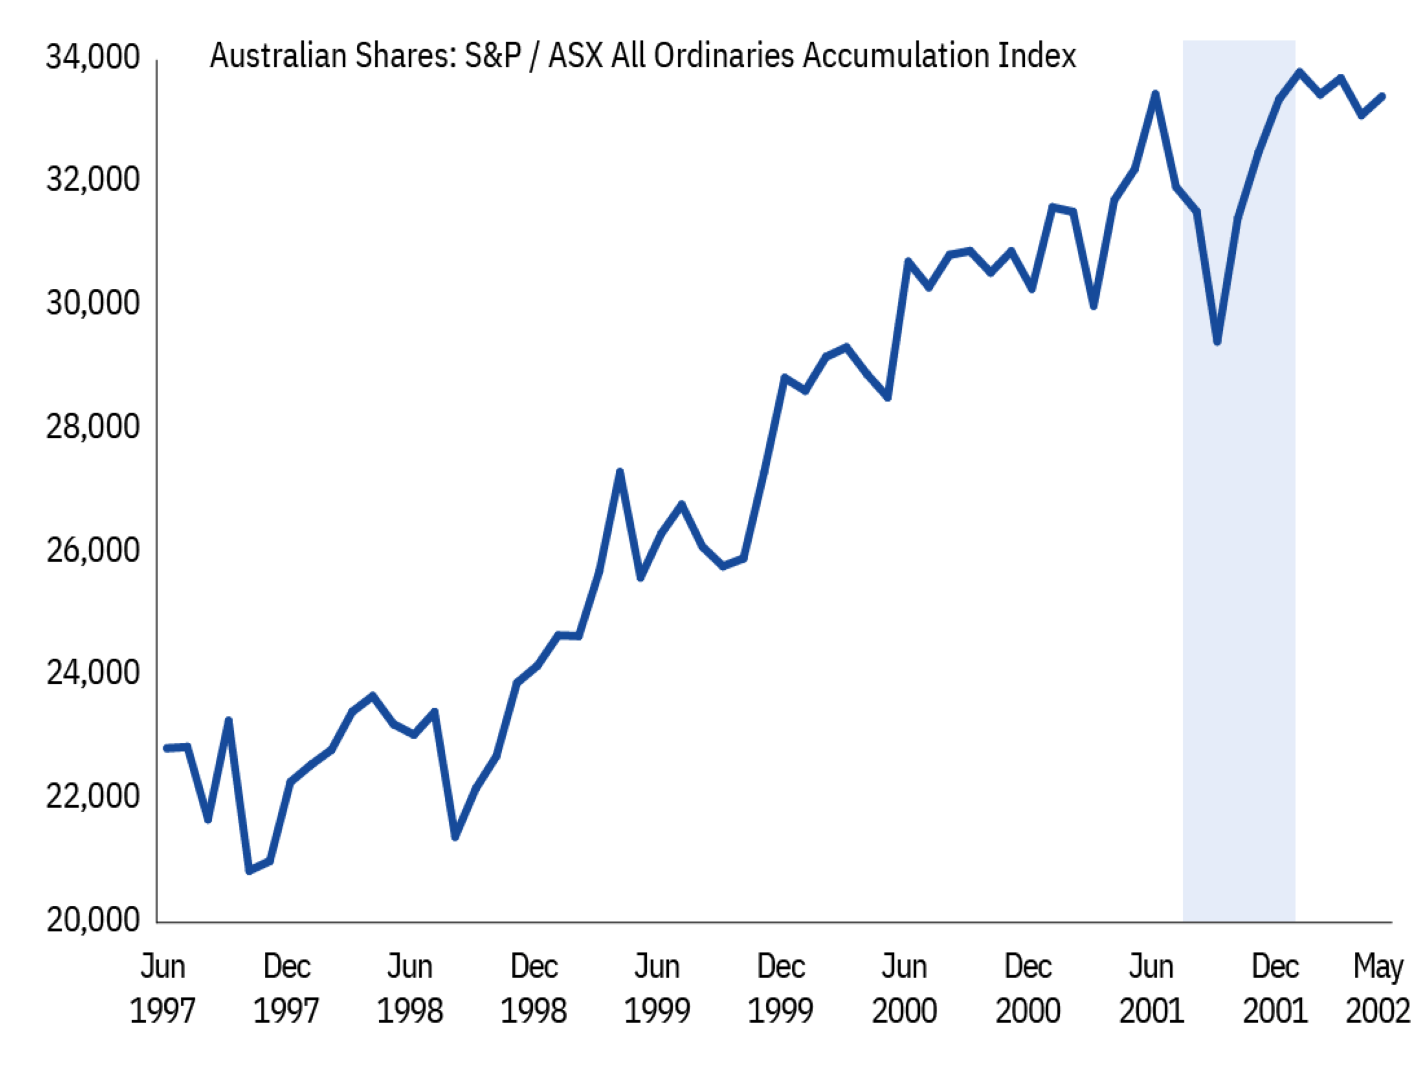
September 11 attacks 2001
Why did this happen?
Almost 3000 lives were lost when four planes were deliberately crashed into strategic locations around the US on 11 September 2001. Almost all of these deaths were in New York, where al-Qaeda destroyed the World Trade Centre towers which sat at the heart of the financial district.
What did it mean for investors at the time?
In the days after the attack, markets dropped. The S&P500 fell 11% (extending the losses from the tech wreck earlier that year) while in Australia, the ASX200 lost 4.11% in a single session, before reaching a bottom on 24 September, 9.79% below its pre-attack level.
What was the best thing investors could do at the time?
Both the US and Australian share markets recouped all these losses only a month later. By taking a long-term view of investing, you can ride out any short-term dips in the market and take advantage of growth opportunities over the long term.

Source: S&P Index Data Services. S&P/ASX All Ordinaries Accumulation Index. Date from 30 June 1997 to 31 May 2002.
So, what’s the key thing to take away from these three examples? When markets fall sharply, it’s only natural to be concerned and think about moving money to less risky investment options – with a plan to switch back later. Yet as history has shown, it is important to consider staying invested at times of market volatility to enable your investments to benefit when the market rebounds.
Source: Colonial First State


